
A Circle Graph Paper – A circle graph is a way to visually represent data. It is usually created by dividing a circle into sections that represent different parts of the whole. The sections are then labelled with the appropriate information. Circle graphs can be used to represent many different types of data, such as percentages, fractions, and decimals.
- Graph Paper for maths
- polar Graph Paper
- printable Graph Paper
- Graph Paper with numbers
- Graph Paper a4
- coordinate Graph Paper
- Graph Paper in excel
- engineering Graph Paper
- cartesian Graph Paper
- triangle Graph Paper
- isometric Graph Paper
- knitting Graph Paper
- transparent Graph Paper
- virtual Graph Paper
Circle Graph Paper
The Circle graph paper can be used for a variety of purposes. It is often used to create pie charts, which are a type of graph that shows how data is distributed. Circle graph paper can also be used to create Venn diagrams, which are a type of diagram that shows how different sets of data overlap.
Let’s learn how to make a circle graph on paper from the images and pdf given.
A circle graph, also known as a pie chart, is a visual representation of data that uses slices to show how much each category makes up of the whole. You can make a circle graph on paper by following a few simple steps. First, draw a circle and divide it into equal sections. Then, label each section with the data you want to represent. Finally, colour in each section according to its value. Circle graphs are an easy way to visualize data and compare proportions.
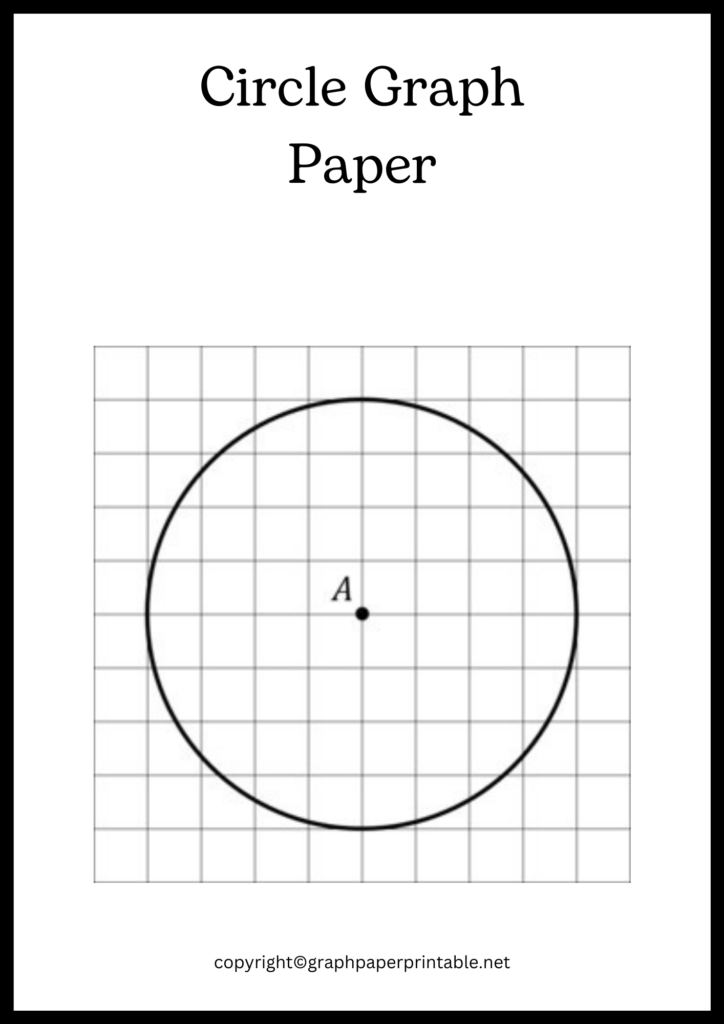
How to Draw A Circle On Graph Paper?
A circle is one of the most basic shapes in geometry, and learning how to draw one is a fundamental skill for anyone studying mathematics or engineering. The easiest way to draw a circle is by using graph paper.
Here’s a step-by-step guide:
1. Begin by drawing a dot in the centre of your graph paper square. This will be the centre of your circle.
2. Use a ruler to draw a line from the centre dot out to the edge of the square. This will be the radius of your circle.
3. Use a compass or your ruler to draw an arc from one side of the radius line to the other. This will be the circumference of your circle.
4. Erase any extra lines and you’re finished! Your circle is now ready to be used in whatever mathematical equation or drawing you need it for.
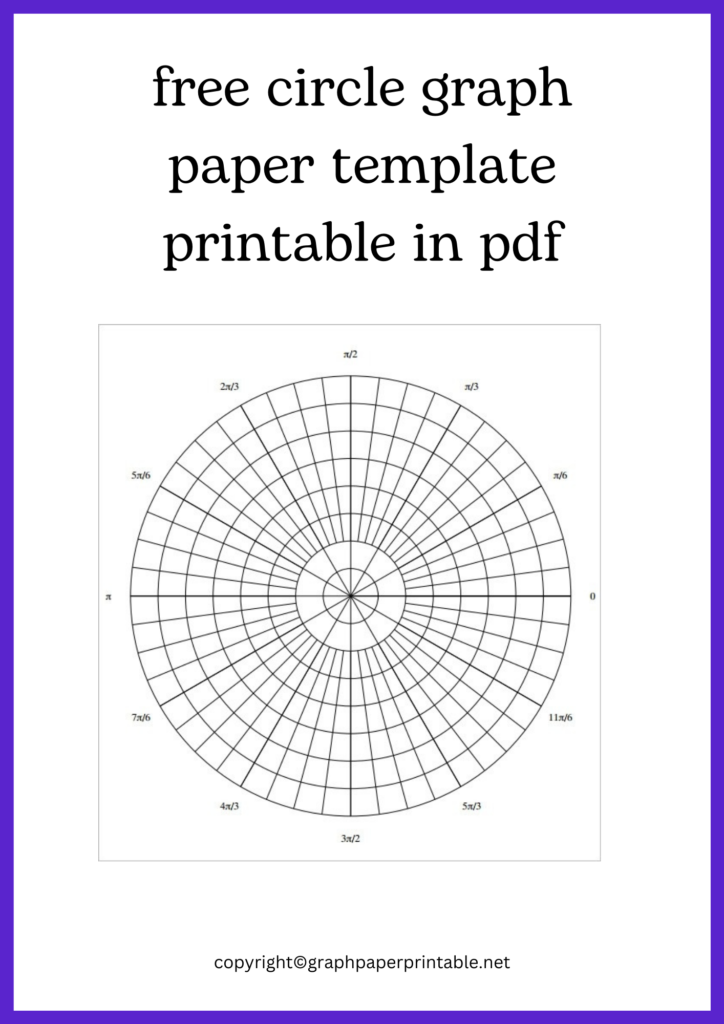
There are many benefits to using a free circle graph paper template printable in pdf. One benefit is that it can help you save time. With this template, you can print out as many copies as you need, so you don’t have to waste time tracing or drawing circles yourself.
Another benefit is that it can help you achieve more consistent results. When you use a template, all of your circles will be the same size and shape. This is helpful if you’re creating a design or presentation that needs to look polished and professional.
Finally, a free circle graph paper template printable in pdf can also be a handy tool for students or anyone who wants to learn how to create graphs and charts. By using a pre-made template, you can see how the various elements of a graph come together.